Global Redesign of Model Portfolio Pages
Organization:
Role:
Timeline:
Impact:
State Street Investment Management
UX Lead – Product Designer Lead (Managed a 8 person cross-functional team)
6 Months
Transition traditional, high-density PDF factsheets into an interactive "Search & Evaluate" hub to empower financial advisors.
01. The Strategic Challenge
Reclaiming Market Position through Design
From Static PDFs to Actionable Insights
Advisors were traditionally bogged down by “Due Diligence Checklists” and static PDFs, making it difficult to compare diverse investment outcomes. The challenge was to take the complex data from the Investment Solutions Group (ISG)—the team managing money for central banks and pension funds—and make it scannable and interactive for wealth managers.
The Problem:
• Information Density: Factsheets contained 15+ years of performance history and complex “Alpha Meeting” data that was difficult to parse quickly.
• Discovery Friction: No easy way for users to filter models based on specific client goals (Growth, Income, or Capital Preservation).
• Comparison Gap: Users lacked a digital tool to compare different ETF models (e.g., Active vs. Strategic) side-by-side
02. Research & Diplomacy
Bridging Quantitative Analysis and Qualitative UX
I worked closely with the ISG team of 130+ strategists and analysts to ensure that our digital representation of “Model Matters” remained institutionally accurate while becoming more accessible.
User Insights:
• Decision Framework: Advisors needed an 8-factor due diligence framework to evaluate providers.
• Goal-Centricity: Users don’t search for “products”; they search for “outcomes” like “Growing assets over the long-term” or “Generating higher income”.
• Transparency: High-net-worth clients require clear “Hypothetical Growth of $10K” visualisations to build trust
03. Strategic Orchestration
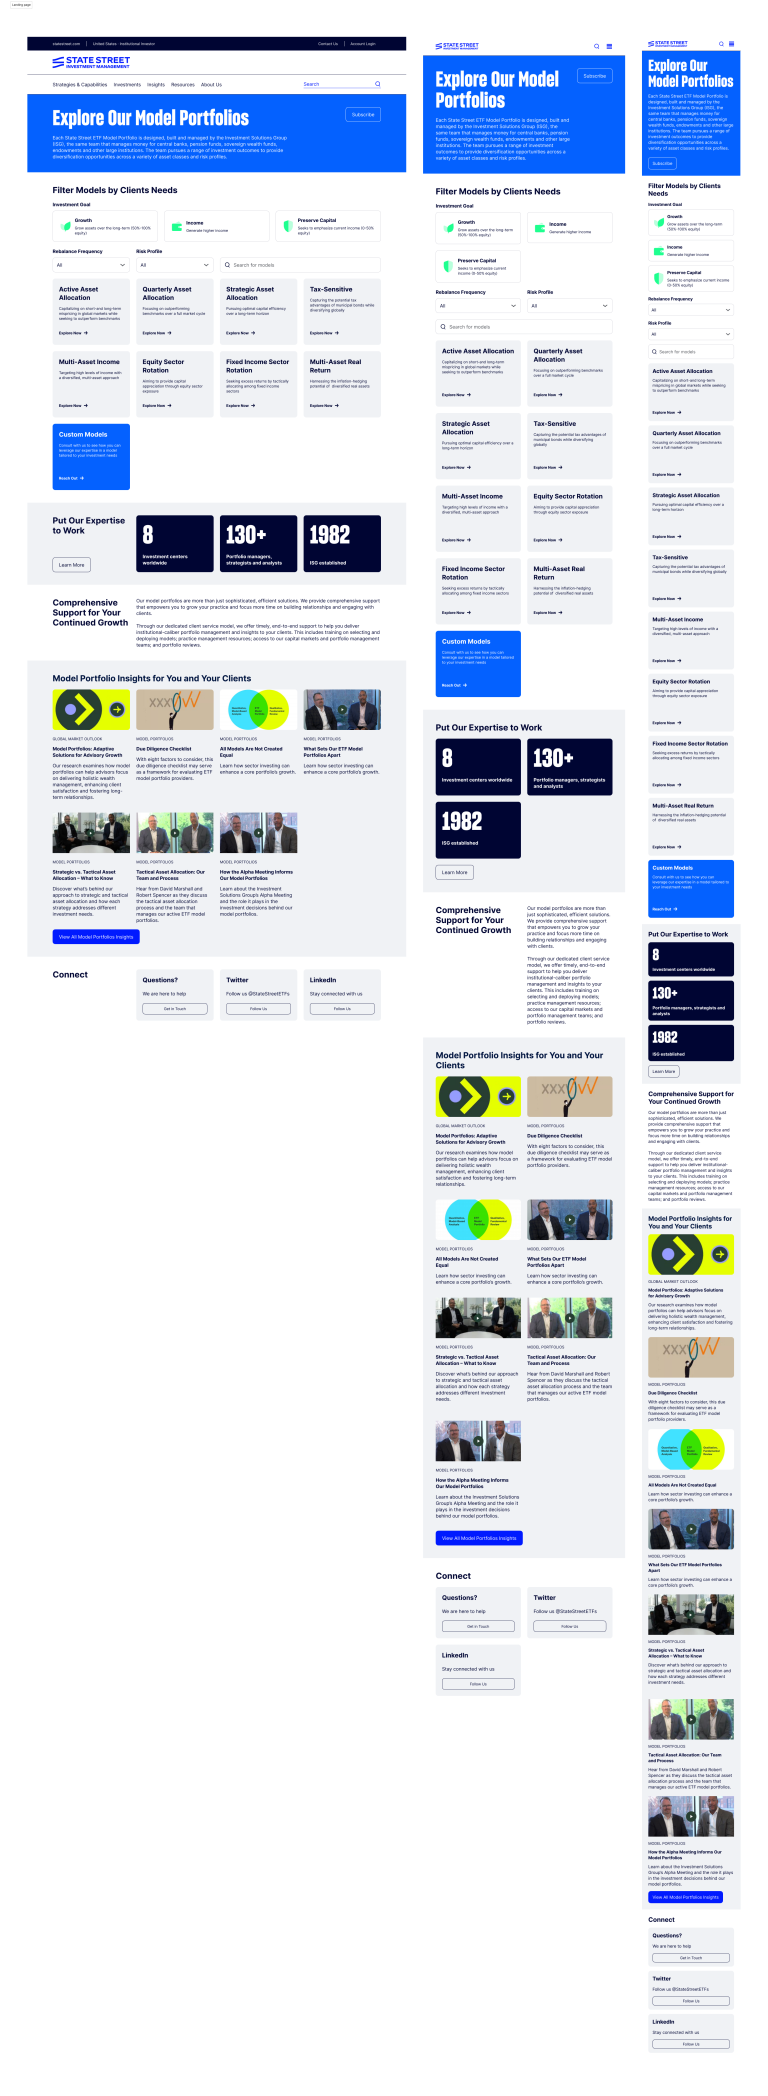
Designing the “Model Portfolio Landscape”
The strategy focused on a multi-layered navigation model that allowed users to move from high-level “Explore” pages to granular “Performance” tabs without losing context.
The Filter Engine: We developed a robust filtering system that allowed users to sort 130+ years of collective expertise by:
• Investment Goal: Growth, Income, or Preserve Capital.
• Investment Vehicle: ETFs vs. Mutual Funds.
• Operational Specs: Trade Frequency, Tax Efficiency, and Investment Cycle.
04. Design & Execution
Interaction Design for Complex Data
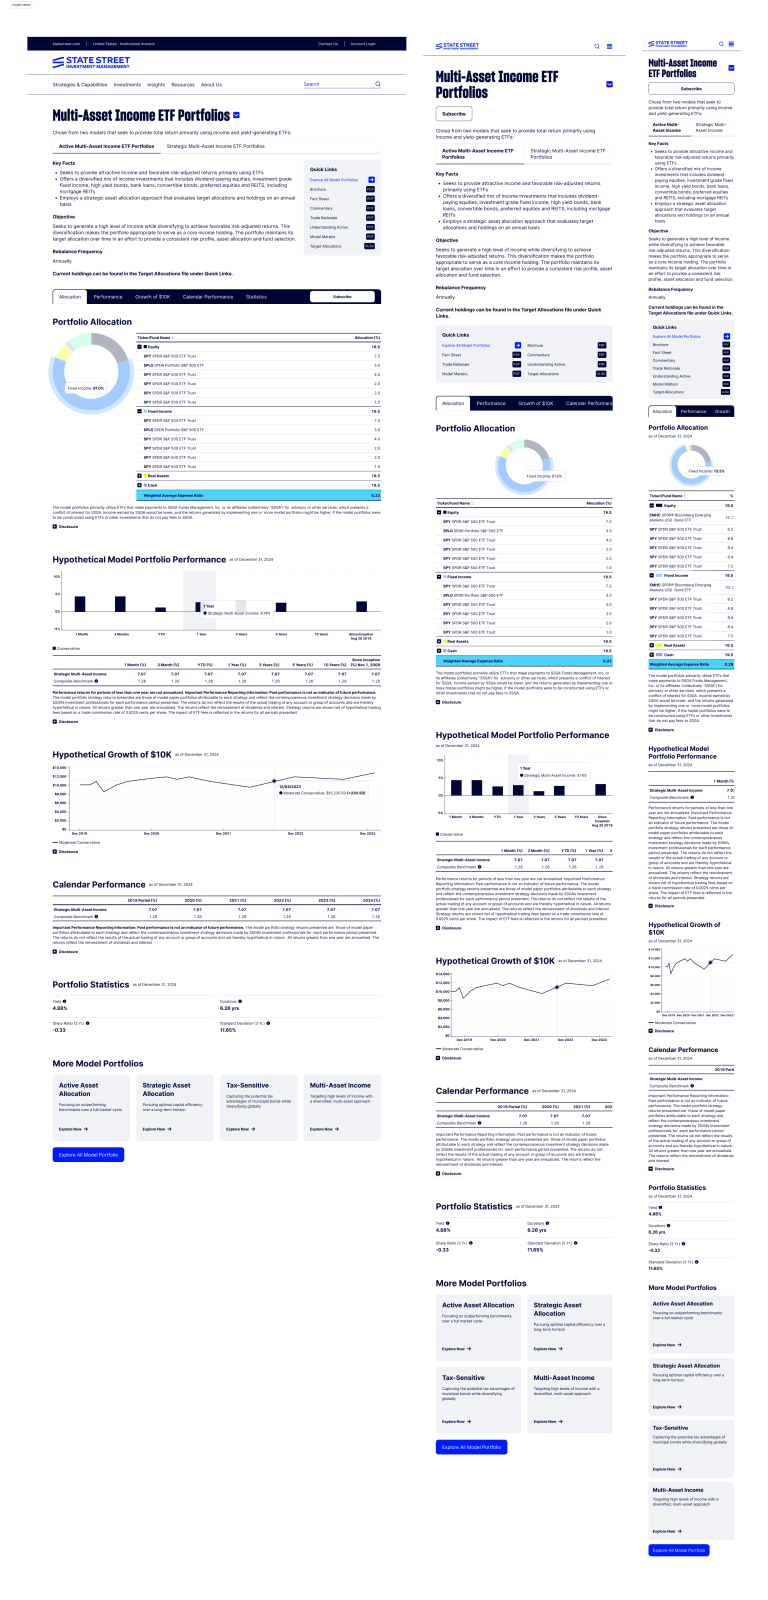
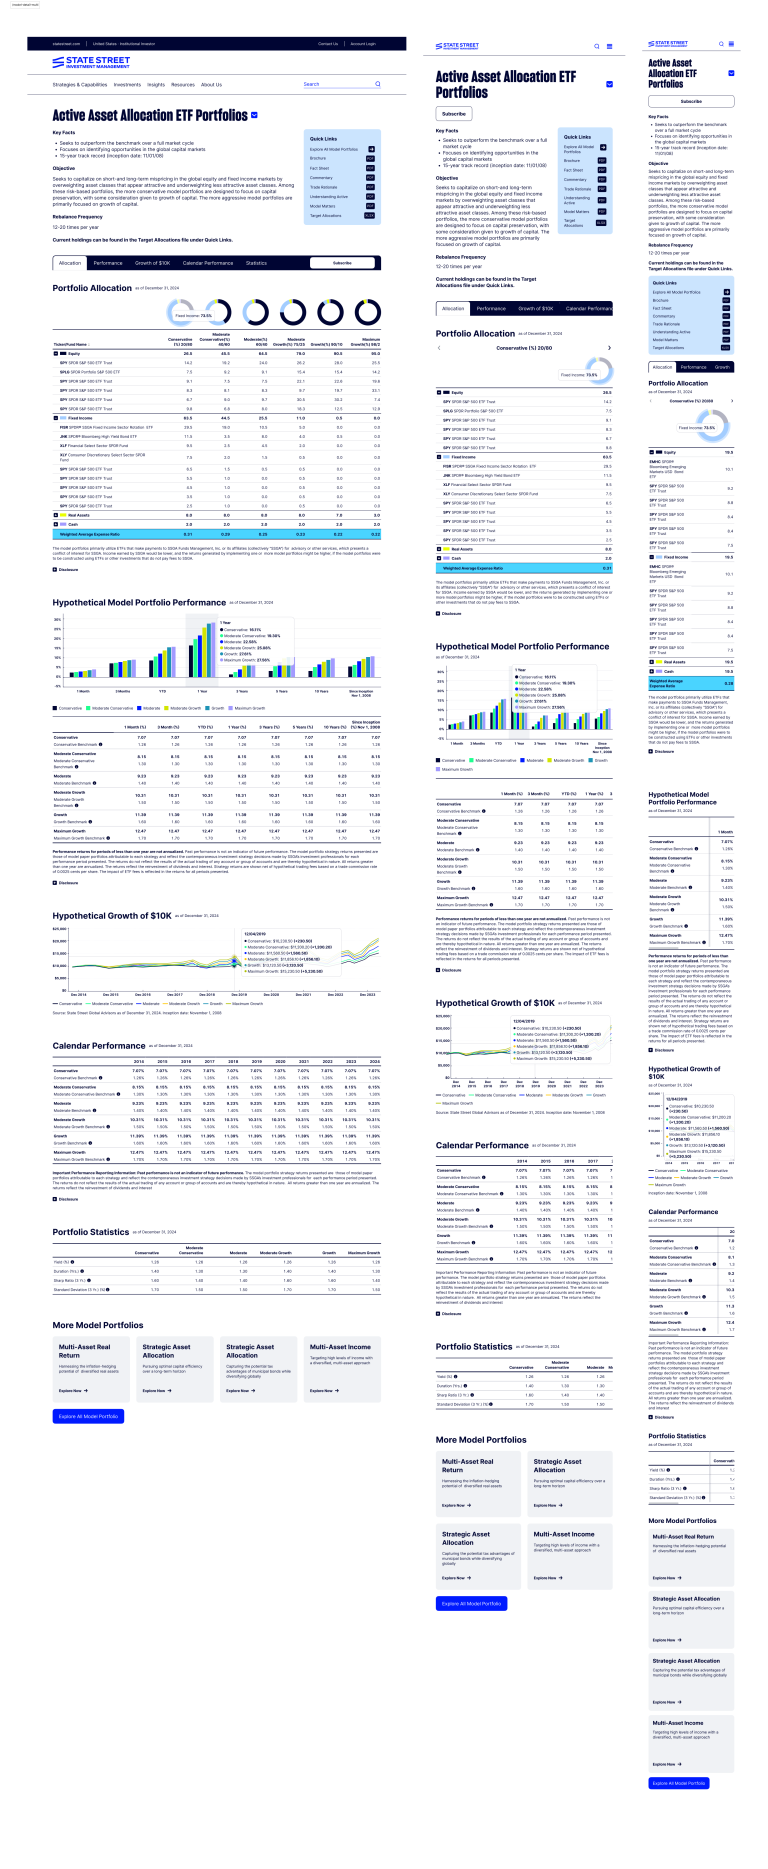
We replaced static tables with a Modular Tabbed Interface (Allocation, Performance, Growth, Yearly Returns, Statistics) to manage cognitive load.
Interactive Features:
• Dynamic Portfolio Allocations: Used interactive donut charts to show the split between Equity, Fixed Income, and Cash across the risk spectrum (Conservative to Maximum Growth).
• Performance Visualisation: Converted hypothetical performance data into interactive bar charts ranging from 1-month to “Since Inception” views.
• Comparison Tool: Built a “Compare ETF Model Portfolios” feature allowing users to select up to 4 models and view their “Multi-Asset Real Return” or “Sector Rotation” stats side-by-side.
• Quick Links Integration: Ensured that essential documents like “Trade Rationale” and “Target Allocations” remained one click away for deep-dive due diligence
05. The Impact
Empowering Advisor Growth
By adding interactivity and a user-friendly layer to the institutional factsheet data, we achieved significant operational wins:
• Institutional Reach: Digitised a platform supported by 8 global investment centers and established in 1982.
• Efficiency: Enabled advisors to “Start Evaluating Now” using the interactive due diligence framework.
• Clarity at Scale: Successfully represented a 15-year track record through scannable, interactive “Growth of $10K” charts.
• Holistic Support: Integrated “Model Portfolio Insights” and videos from the team directly into the product journey to enhance client satisfaction.
06. Senior Reflections
Aesthetics as a Trust Signal
In the Model Portfolio space, interactivity is a function of transparency. By taking the “Alpha Meeting” decisions and making them visually interactive, we moved from “telling” the advisor what happened to “showing” them how it works. This redesign proved that institutional-caliber portfolio management can—and should—be as intuitive as a consumer app without sacrificing professional depth.